

In the drug discovery process, understanding a compound’s mechanism of action (MoA) is crucial to rationalizing its phenotypic effect and mitigating potential side effects. Despite its critical role, understanding MoA can be challenging and costly, and many choose to forego it since it is not a requirement for Food and Drug Administration (FDA) approval1. Recent advancements in data science offers systemic understanding of a drug's MoA, enhancing the prediction of side effects and interactions with other therapies.
Immunotherapy for Cancer: Understanding the Mechanism of Action for Advanced Treatments
The development of immunotherapy as a treatment for cancer hinges on the understanding of its mechanism of action (MoA). Unlike traditional chemotherapies, immunotherapies engage the body’s immune system to recognize and combat malignancies. This precise engagement relies on the MoA, describing how these therapies operate at the molecular and cellular levels to trigger an immune response against cancer cells.
Antibodies play a pivotal role in immunotherapy science. Monoclonal antibodies, designed to bind to specific antigens on cancer cells, can mark those cells for destruction by the immune system the body’s natural defenses. Other antibodies are designed to bind receptors on immune cells and activate an otherwise dormant immune response to the cancer.
However, the complexity of cancer and the immune system often means that single-agent therapies do not work uniformly across all patient populations. This is where combination therapies come into play, which involves using two or more treatments concurrently to attack the cancer in different ways. Yet, the broad success of combination therapies is hindered by several factors, one of which is the lack of patient stratification.
Stratification categorizes patients according to specific traits, like genetic markers or the presence of particular RNA transcripts or proteins, to anticipate their response to treatment. Insufficient patient stratification can lead to ineffective combination therapy cancer type and disease state, leading to suboptimal outcomes and unnecessary exposure to potential side effects.
The Role of Data Science
Several different data sources offer various insights into MoA biology. The “omics”—transcriptomics, proteomics, metabolomics, and phosphoproteomics—each play a role in uncovering different levels of the overarching pathway in which the mechanism of action operates2. Transcriptomics offers insights into how genes are being actively expressed in response to a compound, shedding light on changes in cellular signaling pathways and transcription factor activity. Proteomics, on the other hand, reveals alterations in protein abundance and modifications, unveiling the downstream effects of compound interactions with cellular components. Metabolomics captures shifts in metabolite levels offering insights into affected metabolic pathways. Phosphoproteomics highlights alterations in protein phosphorylation, unveiling key events in activated cell signaling cascades.
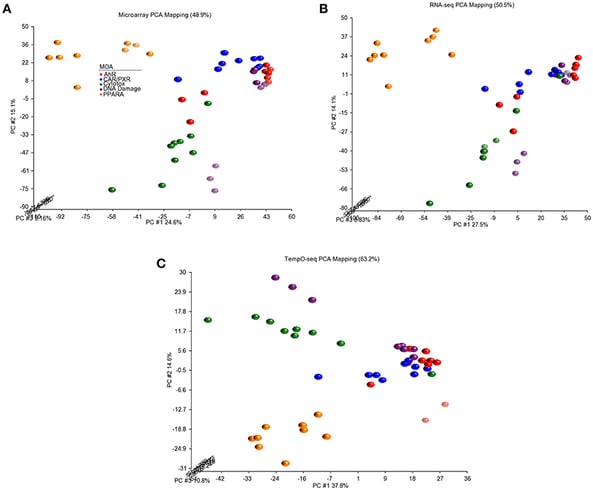
In the field of transcriptomics, advancements in high-throughput technologies are facilitating the processing of vast amounts of data, making it a prominent avenue for comprehending mechanisms of action. Noteworthy high-throughput methods like the L1000 assay, DRUG-Seq, and TempO-Seq have been devised to accommodate extensive data acquisition3. Recent strides in single-cell technology empower researchers to identify changes in gene expression data specific to different cell types. This departure from conventional bulk tissue-level measurements enhances the characterization of transcription factors implicated in a drug’s MoA.
Approaches for Transcriptomic Analysis Methods
Transcriptome analysis methods include Pathway Analysis (PA) and Gene Set Enrichment Analysis (GSEA) are two distinct approaches used in bioinformatics to unravel the biological context and mechanisms underlying gene expression data.
PA focuses on analyzing the expression of genes within predefined biological pathways or functional
categories4. It assesses whether genes associated with specific pathways are overrepresented in a list of differentially expressed genes compared to what would be expected by chance. This approach provides a comprehensive view of how genes work together in cellular processes and can highlight which pathways are most relevant to the observed changes in gene expression.
On the other hand, GSEA evaluates whether a predefined set of genes, often representing a pathway biological function, shows significant changes in expression between different sample groups5. GSEA doesn't rely on predefined categories; instead, it considers the entire dataset and identifies whether the distribution of gene expression ranks within a gene set significantly differs between groups. This method is beneficial for identifying subtle but coordinated changes in expression across a gene set, even if individual genes within that set may not be significantly differentially expressed.
These methods contribute to MoA elucidation by providing a functional context for gene expression changes. They help researchers understand the biological processes affected by a treatment, condition,
or genetic alteration. PA provides a focused view of specific pathways or functional groups that are impacted, while GSEA offers a more data-driven approach to uncover enriched gene sets, potentially revealing novel associations. Together, these methods aid in connecting molecular changes to biological functions, shedding light on the intricate mechanisms underlying observed phenotypic effects and guiding further investigations into potential therapeutic targets or adverse effects.
Visualizing MOA
Transforming the raw data from PA and GSEA into comprehensible narratives, data visualization methods help guide researchers toward a deeper understanding of how compounds orchestrate their effects6,7.
Key visualizations include:
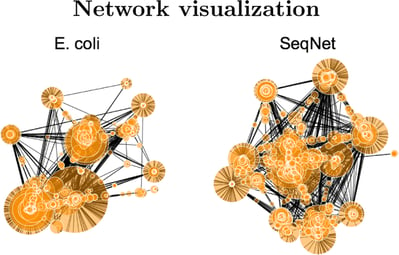
Gene-concept networks
These data visualization methods depict the linkages of genes and biological concepts as a network, aiding researchers in identifying key nodes influenced by a compound.
Gene expression heatmaps
Heatmaps graphically represent gene expression changes across conditions, enabling researchers to
detect patterns of activation and inhibition. Rows capture genes, while columns depict varying phenotypically observed conditions.
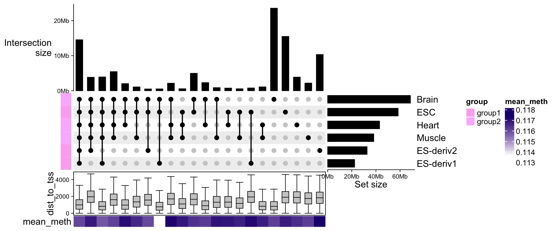
UpSet Plots
UpSet plots reveal intersections and overlaps among gene sets influenced by a compound. These insights unveil pathways consistently impacted, offering a panoramic view of its biological effects.
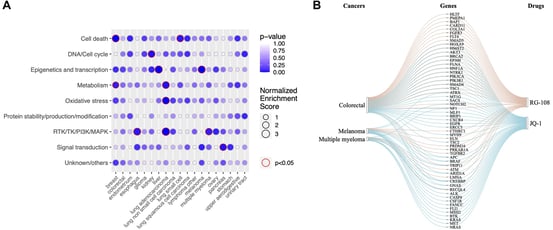
Enrichment Plots
Enrichment plots chronicle the trajectory of enrichment scores, uncovering the enrichments and depletions within gene sets. These graphs serve as the conduit to understanding MoA.
Ridgeline Plots
These plots visually depict the distribution of enrichment scores or p-values across different pathways, offering insights into the significance and trends of pathway enrichment.
Gene Set Cloud
Gene set clouds cluster results, highlighting gene sets with shared biological themes. These clusters provide an intuitive understanding of the larger narrative woven within the data.
These visual tools, backed by data insights, uncover the complexities of MoA, offering researchers systems view of molecular interactions, gene expression shifts, and functional pathways. Through pathway analysis and gene set enrichment analysis, bioinformatics empowers drug development with precision and foresight.
Have Confidence in Your Results with g.nome®
For both bulk and single-cell RNAseq, g.nome offers transparent and modifiable workflows. The intuitive and easy-to-use interface encourages autonomous exploration and collaboration across your organization. Our bulk RNAseq workflows allow you to identify differentially expressed genes between your experimental conditions and explore MoA through pathway and gene set enrichment analysis. Our single-cell RNA seq workflows generate sharable reports to visualize cell clustering, cell type annotation, and gene expression data. With g.nome, you have access to unlimited iteration, giving you higher confidence in your results and a higher probability of identifying and delivering innovative therapies to those in need. Sound interesting? Reach out to explore the platform for yourself.
References
- Mechanism matters. Nat. Med. 16, 347–347 (2010).
- Trapotsi, M.-A., Hosseini-Gerami, L. & Bender, A. Computational analyses of mechanism of action (MoA): data, methods and integration. RSC Chem. Biol. 3, 170–200 (2022).
- Bushel, P. R., Paules, R. S. & Auerbach, S. S. A Comparison of the TempO-Seq S1500+ Platform to RNA-Seq and Microarray Using Rat Liver Mode of Action Samples. Front. Genet. 9, 485 (2018).
- García-Campos, M. A., Espinal-Enríquez, J. & Hernández-Lemus, E. Pathway Analysis: State of the Art. Front. Physiol. 6, (2015).
- Ackermann, M. & Strimmer, K. A general modular framework for gene set enrichment analysis. BMC Bioinformatics 10, 47 (2009).
- Subramanian, A. et al. Gene set enrichment analysis: A knowledge-based approach for interpreting genome-wide expression profiles. Proc. Natl. Acad. Sci. 102, 15545–15550 (2005).
- Reimand, J. et al. Pathway enrichment analysis and visualization of omics data using g:Profiler, GSEA, Cytoscape and EnrichmentMap. Nat. Protoc. 14, 482–517 (2019).

Kit Fuhrman
Kit Fuhrman is an experienced product manager in the biotech industry. Dr. Fuhrman has built impactful products ranging from NGS sequencing reagents for translational scientists to spatial biology platforms for pioneering researchers. He has a doctorate from the University of Florida in Immunology, studying the role of regulatory T cells in type-1 diabetes, and a master's degree from the University of Central Florida, studying HIV entry inhibitors.