
The Partner
Led by Avery D. Posey, Jr., Ph.D., the Posey Lab at the University of Pennsylvania Perelman School of Medicine focuses on the development of novel cancer therapies for humans and dogs that genetically alter cancer patients’ own T cells to improve the ability of the immune system to fight cancer. This research involves antigen discovery to identify tumor-specific targets, engineering strategies to surmount the tumor microenvironment, and altering the signaling influences of T cells to develop robust anti-tumor efficacy.
The Problem
The Posey Lab Team aimed to replicate the cutting-edge single-cell RNA sequencing (scRNA-Seq) analysis performed in Galletti et al.'s 2020 paper on human CD8+ memory T cells. Faced with a lack of analysis infrastructure, the lab sought an accessible yet robust solution capable of handling large datasets. Key challenges impeding their entry into this project included:
- Complex Workflow Navigation: Constructing an analysis workflow, especially for intricate processes like scRNA-Seq, proves to be a cumbersome task for researchers. This complexity can result in inefficiencies as researchers struggle to locate and activate the required functions in a variety of programs, hindering the seamless initiation of workflows.
- Coding Dependency: Existing infrastructure often relies heavily on coding expertise for constructing and modifying workflows. This coding dependency limits the accessibility of the analysis to researchers with advanced computational skills, excluding those with limited coding knowledge from actively participating in workflow design.
- Workflow Customization Constraints: Researchers often face challenges in tailoring standard workflows to specific research needs. Lack of customization options leads to suboptimal efficiency and precision in data analysis, as the workflows can not be easily adapted to address unique experimental requirements.
- Learning Curve and Uncertainty: Researchers without extensive coding experience encounter uncertainties and face a steep learning curve, particularly in unfamiliar stages or tools within the analysis workflow. These uncertainties create bottlenecks in the research process, delaying project timelines and potentially introducing errors in the analysis of genomic data.
- Rigidity in Tool Integration: Existing workflows often lack flexibility in integrating or modifying tools at different stages of the analysis process. Researchers face difficulties in adjusting or substituting tools for specific steps in workflows like scRNA-Seq, often requiring substantial effort and risking disruption to the entire analysis pipeline.
The Solution
The canvas within the g.nome® platform showcases a top-tier Graphical User Interface (GUI) specifically crafted to enhance user experience and simplify intricate processes, such as the scRNA-Seq workflow.
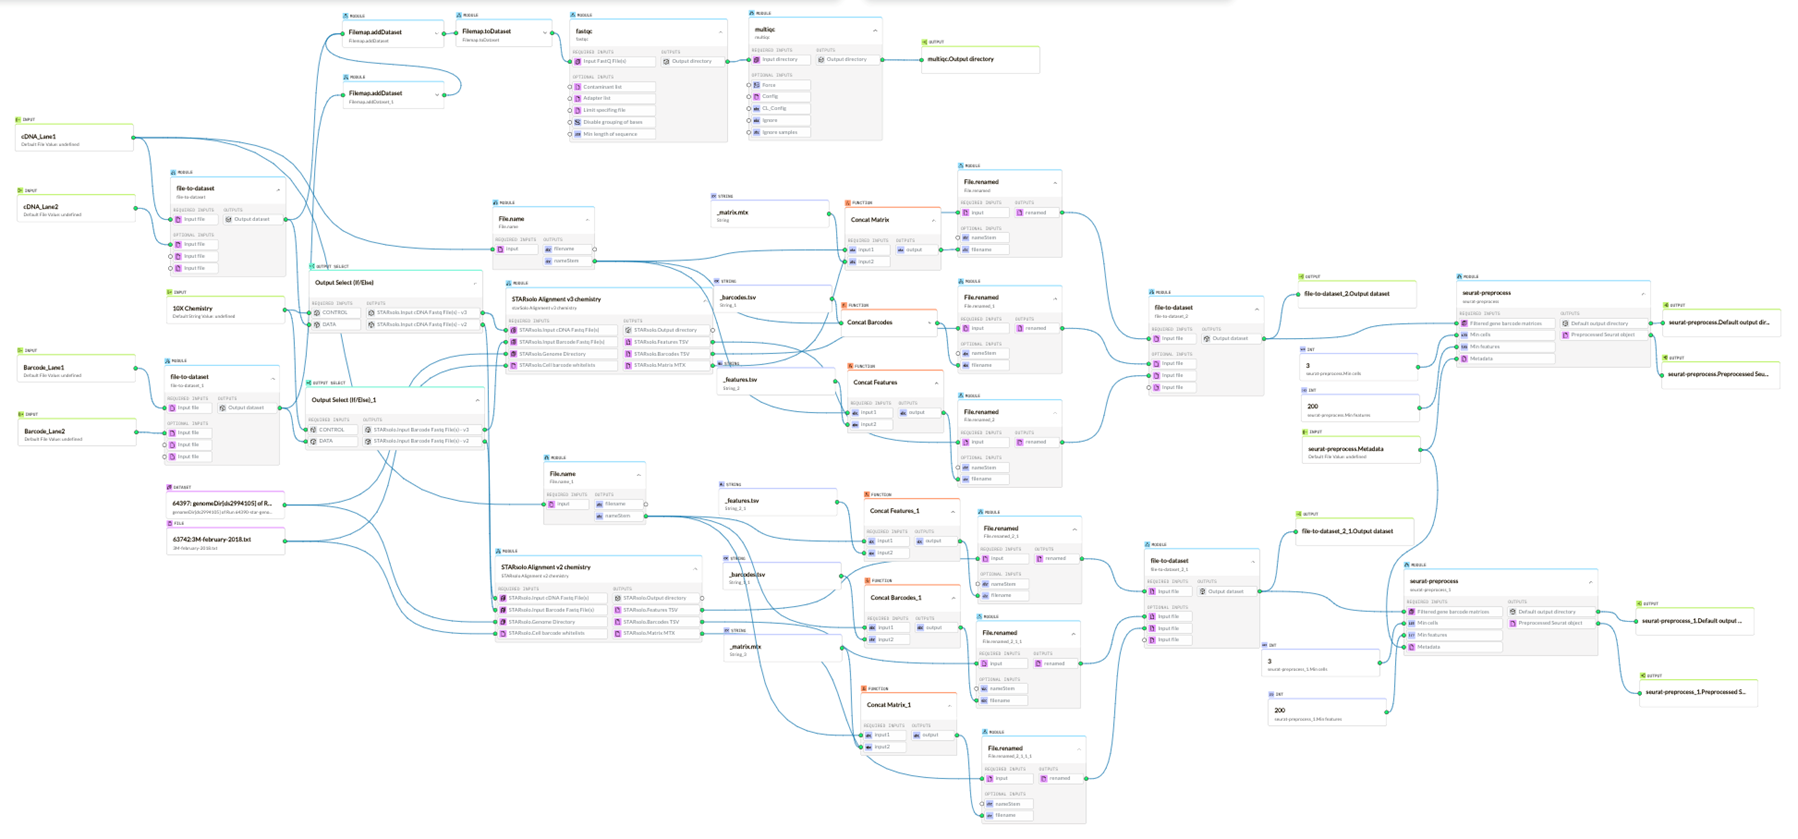
The canvas' GUI ensures smooth execution of these workflows with its:
- Intuitive Layout: The canvas displays a well-organized layout, allowing users to easily pinpoint and activate desired functions. This design ensures that workflows like scRNA-Seq are initiated without a hitch.
- Drag-and-Drop Functionality: Constructing or tweaking workflows becomes effortless with the canvas' drag-and-drop feature. This visual mechanism eradicates the need for complicated coding, opening doors even for those with limited computational know-how.
- Ready-to-Run Workflows: For standard workflows like scRNA-Seq, users can swiftly load preset templates on the canvas. These templates, though ready to use, can be tailored as necessary, optimizing efficiency and precision.
- Help and Tutorials: For those moments of uncertainty or unfamiliarity with specific stages or tools, the canvas comes equipped with built-in tutorials. These aids navigate users through the process, offering assistance and ensuring the accuracy of workflows like scRNA-Seq.
- Modular Design: Flexibility is key, and the canvas’ GUI facilitates modular tool integration. Should a particular step in the scRNA-Seq workflow require adjustments or substitutions, it can be executed without derailing the entire process.
The Results
Easy Replication
Using the g.nome platform, the team was able to execute the standard Seurat pipeline for scRNA-Seq data analysis, generating the UMAP plot below. The process began with quality control to filter out low-quality cells and genes, followed by normalization to account for differences in sequencing depth. Subsequently, they identified highly variable genes to concentrate on those most informative for clustering. They then scaled the data and performed principal component analysis to reduce dimensionality. Finally, they applied the UMAP algorithm to project the data into two dimensions, revealing distinct clusters representing potential cell subsets. The team achieved this visualization within g.nome's interface, showcasing its efficacy in managing and analyzing complex genomic datasets.
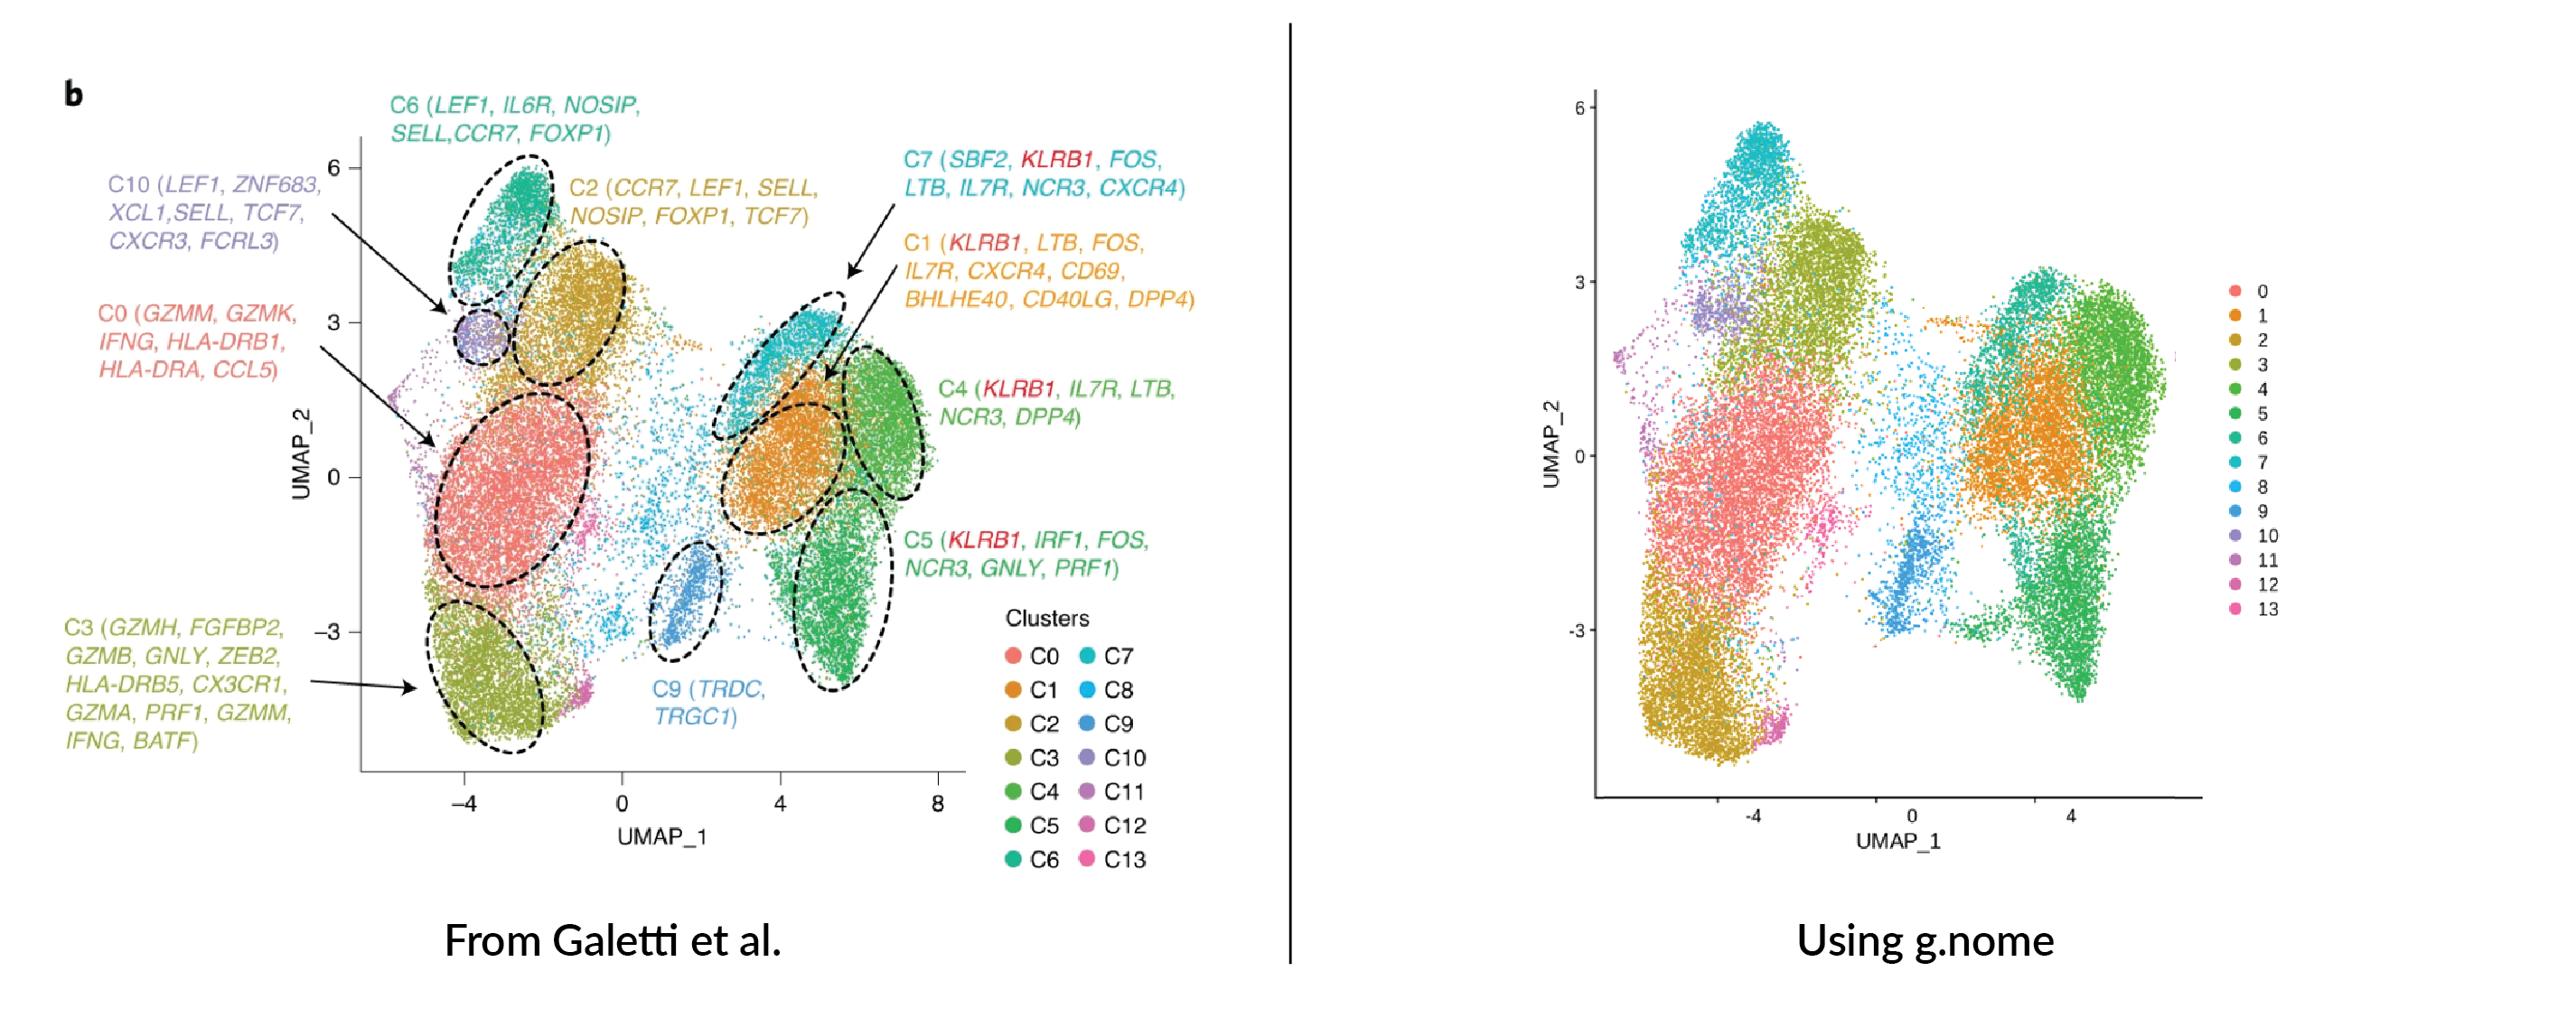
The clustering pattern mirrors that of Galletti et al.'s UMAP, with an identical number of clusters. The congruence in clustering underscores the accuracy of our analytical approach and attests to the reproducibility facilitated by the g.nome platform.
Novel Findings
Further leveraging the g.nome platform's integration with the Seurat toolkit, the team extended their investigation to examine differential gene expression across the identified cell clusters. This enabled them to explore genes that might not have been highlighted in the original paper. Through pairwise comparisons between clusters, the team isolated genes of interest that showed significant variation in expression levels. These genes could serve as potential biomarkers or therapeutic targets, offering new insights into cellular functions and pathways that warrant further study.
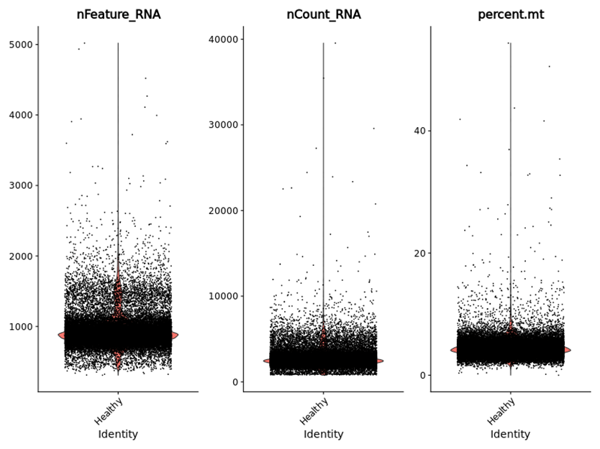
The team utilized several of the visualization features in g.nome to identify and present these targets:
- Cell Quality Overview: Examines unique genes detected (nFeature), total transcript counts (nCount), and mitochondrial content distribution in each cell (percent mt), revealing potential quality issues and correlations.
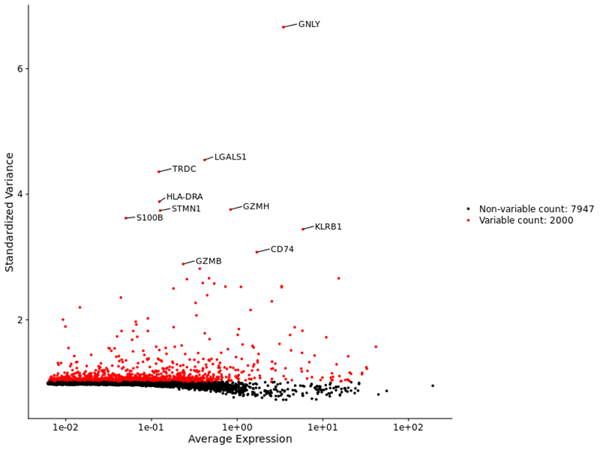
- Visualization of Highly Variable Features: Scatter plot highlighting top variable features based on cell-to-cell variation.
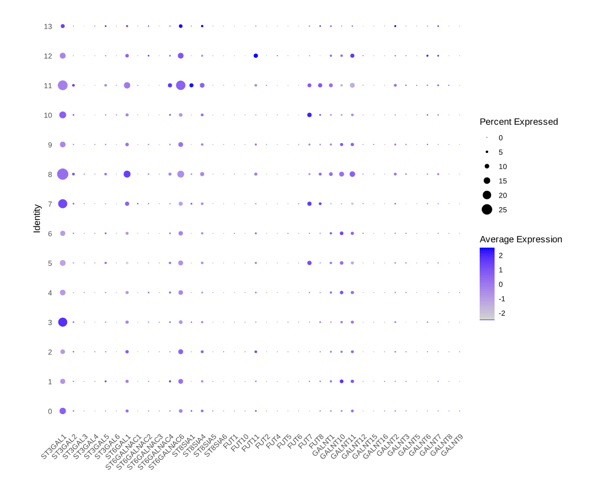
- Differential Expression: Gene expression dot plot visualizes differential gene expression across cell clusters, identifying potential biomarkers and cluster-specific gene signatures.
Conclusion
The work conducted by the Posey Lab using the g.nome platform successfully replicated and extended the findings of the original scRNA-Seq study. This demonstrated not only the robustness of the platform but also its potential to uncover novel genomic insights. The identification of differentially expressed genes between clusters, not discussed in the primary paper, emphasizes the capacity of g.nome to facilitate new discoveries. These findings may inform future research directions and contribute to therapeutic developments.
Don’t take our word for it. Here’s what the Posey Lab team had to say: