

The analysis of Peripheral Blood Mononuclear Cells (PBMCs) holds profound significance in biomedical research, offering a window into the intricacies of immune cell populations circulating within the bloodstream. PBMCs, comprising lymphocytes (T cells, B cells, and NK cells), monocytes, and dendritic cells, serve as sentinels of the immune system, orchestrating responses to pathogens, antigens, and aberrant cells. As such, understanding the composition and dynamics of PBMCs is critical in elucidating the mechanisms underlying immune-related diseases, ranging from autoimmune disorders to infectious diseases and cancer.
In recent years, advancements in single-cell RNA sequencing (scRNA-seq) have revolutionized our ability to dissect the heterogeneity of PBMC populations, allowing researchers to interrogate the transcriptomic profiles of individual cells. Bioinformatics analysis of PBMCs using scRNA-seq holds immense promise for deciphering immune responses, identifying novel cell subsets, and uncovering molecular signatures associated with disease pathogenesis.
In this test case, our researchers utilized the g.nome® platform’s advanced capabilities for cell type identification of 10,000 Peripheral Blood Mononuclear Cells (PBMCs) from a healthy donor. The implications of this cell type annotation research extend to the translational medicine and precision healthcare—by characterizing the composition of an individual’s PBMCs, researchers can more effectively pave the way for the development of tailored immunotherapies. Such personalized approaches have the potential to revolutionize disease management, offering more effective treatments with reduced side effects and improved clinical outcomes. Expediting these findings with an accessible and efficient platform like g.nome contributes to the broader landscape of biomedical research methods, accelerating discoveries that drive innovation and therapeutic development across medicine.
Objectives
- Identify Cell Types: Understanding the composition of cell populations is critical to understanding various diseases, ranging from cancer to autoimmune disorders. Accurate identification and characterization of cell types sheds light on disease mechanisms and paves the way for the development of targeted therapies.
- Perform Automated Cell Type Identification powered by SingleR: Leveraging g.nome's cutting-edge features, particularly the automated cell type annotation powered by SingleR, we demonstrate how to annotate cell types with precision and confidence. By accessing well-curated reference datasets spanning human and mouse origins, we perform a comparative analysis to enhance the accuracy of annotations.
Conclusion
g.nome emerges as an indispensable tool for accelerating single-cell analysis, empowering researchers to characterize cell populations accurately and efficiently. By leveraging advanced bioinformatics methodologies and comprehensive reference datasets, g.nome allows users to bypass time-consuming pain points of scRNA-seq analysis and focus on the results.
Dataset Used: https://www.10xgenomics.com/datasets/10-k-pbm-cs-from-a-healthy-donor-v-3-chemistry-3-standard-3-0-0
Identifying Cell Types
Many diseases, including cancer, autoimmune disorders, and neurological conditions, are linked to specific cell types or changes in cell populations. Identifying and characterizing these cells can provide insights into disease mechanisms and progression. By identifying specific cell types involved in disease, researchers can develop targeted therapies that are more effective and have fewer side effects. This is particularly important in the development of precision medicine. Proper identification of cell types also ensures that research findings are reproducible and reliable.
Cell type identification is critical to gleaning meaningful insights from Single Cell RNA-seq data, but it remains one of the primary challenges of analysis.
Performing Automated Cell Type Identification powered by SingleR
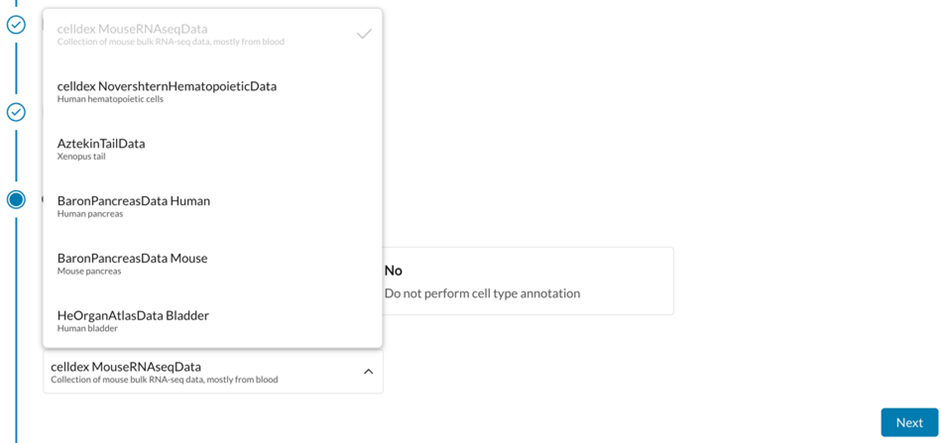
The g.nome platform provides an automated, reference-based cell type annotation feature powered by SingleR. This method leverages well-curated datasets to enhance the accuracy of annotations by building upon existing knowledge. Users can select from an array of 28 reference datasets spanning human and mouse available through the celldex and scrnaseq libraries. This flexibility facilitates experimentation and iterative analysis. The celldex reference libraries offer the ability to annotate cells with varying degrees of resolution, enabling distinction among closely related cell types. G.nome’s annotation tool also returns annotation scores, facilitating comparative analysis of the annotation quality achieved by using different reference datasets.
Collectively, these features empower users to identify cell types with confidence.
Use of Platform
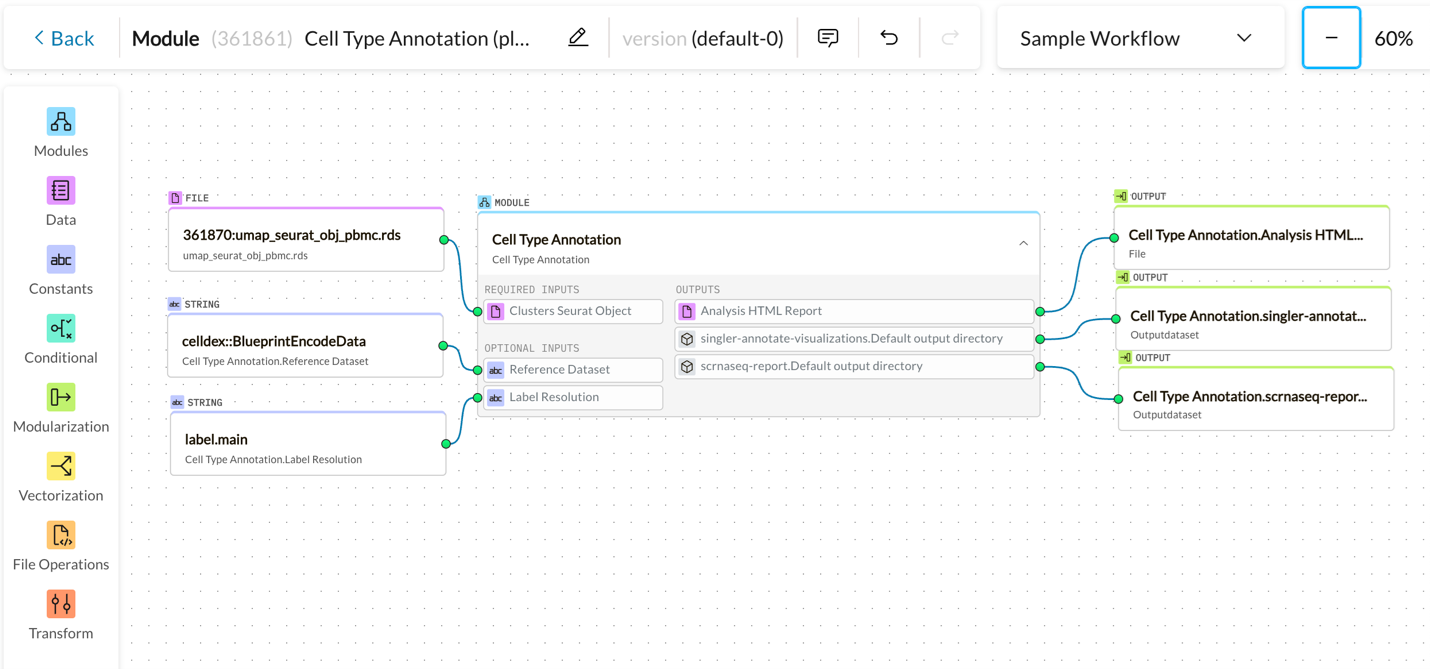
Canvas Workflow
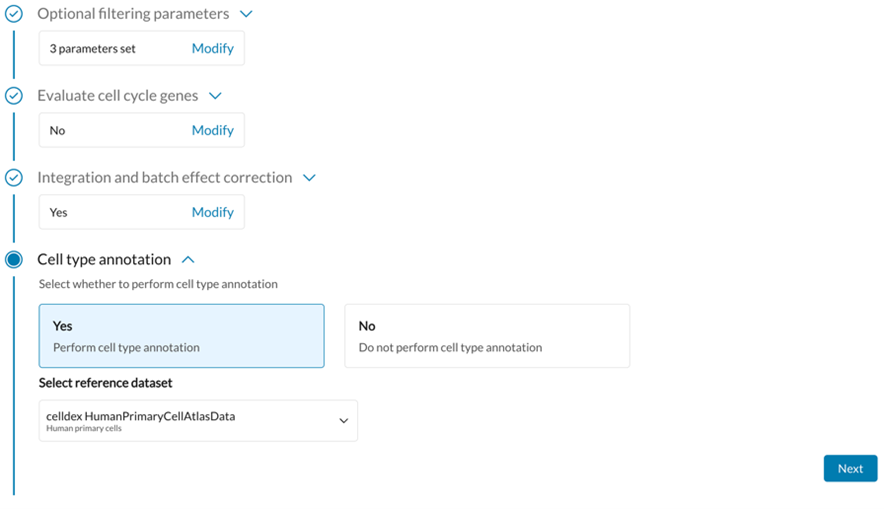
Guided Workflow
Open-Source Tools Used:
- Seurat
- SingleR
- celldex
- scrnaseq
Key Usage Statistics
- Time:
- Annotate 10,000 cells in 4 minutes
- Cost: Unsure, need to do some assessments.
Results
In the analysis, annotations were tested and compared using multiple reference datasets to achieve the highest possible confidence in the findings.
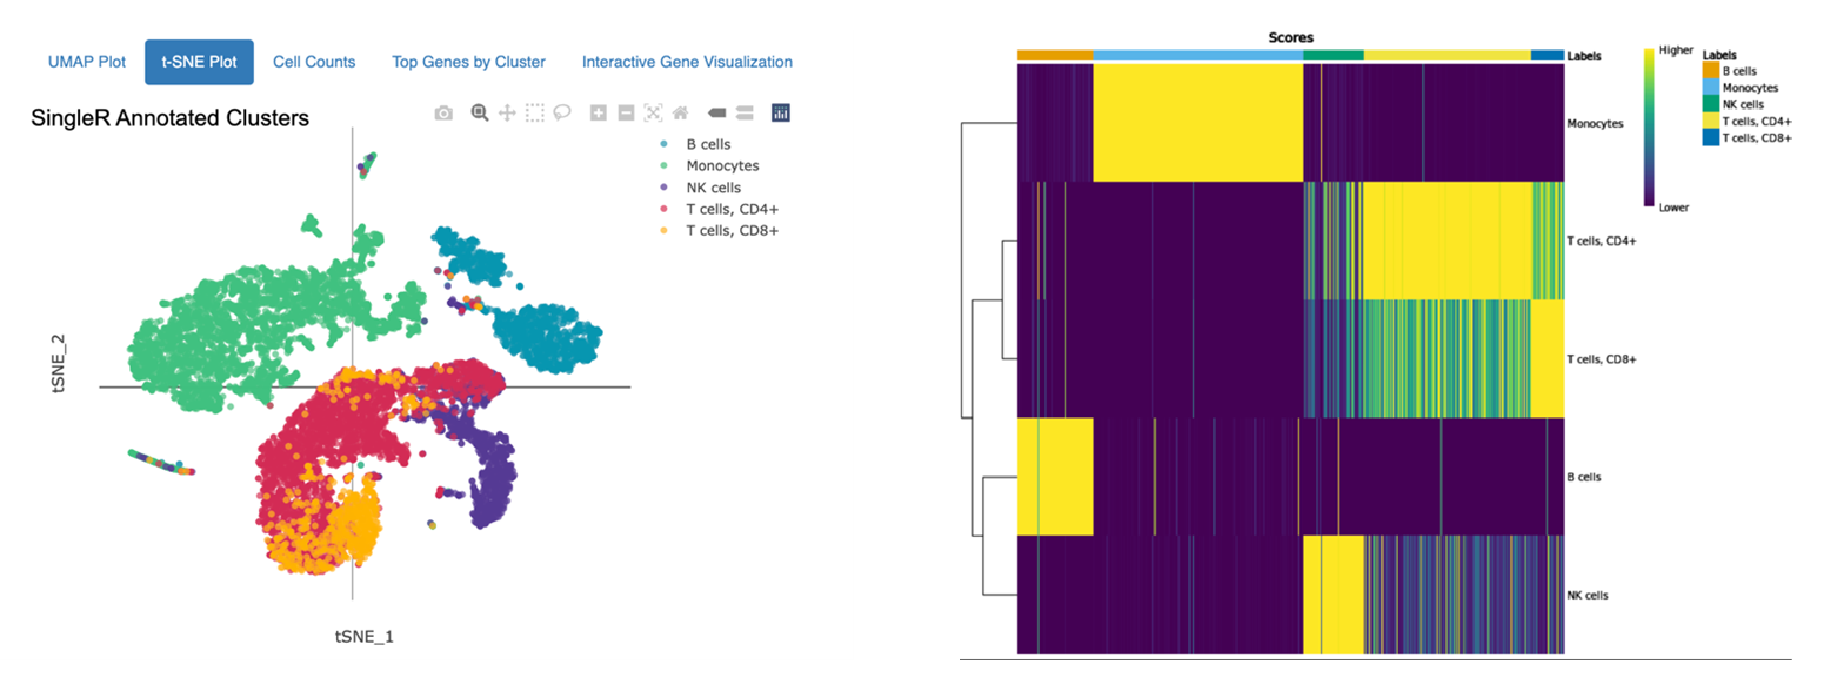
Cell type annotation against Human Primary Cell Atlas
Cell type annotation using Monaco Immune Dataset
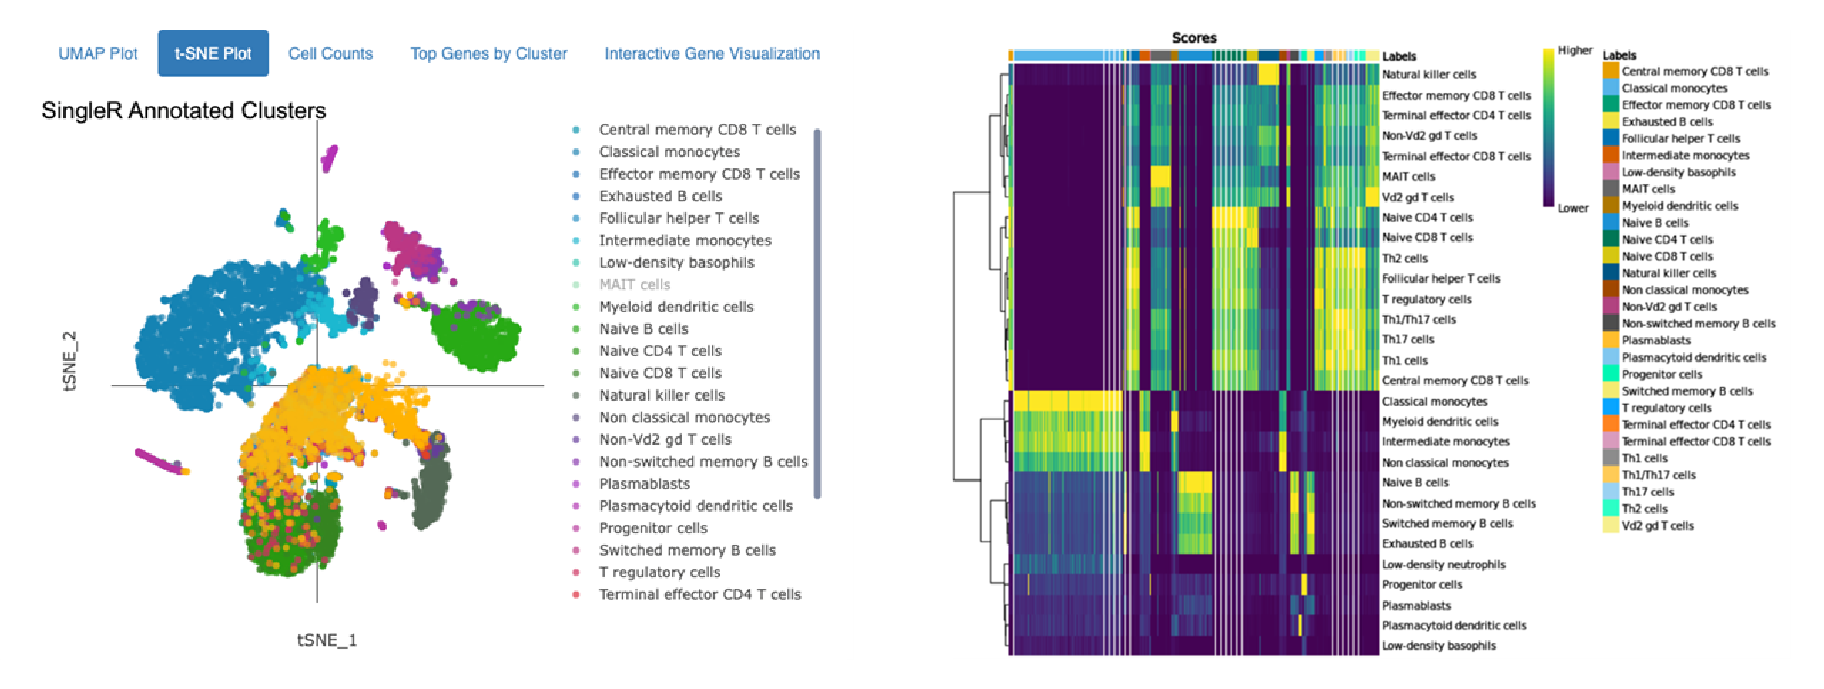
Annotations of 10,000 Peripheral Blood Mononuclear Cells (PBMCs) against the Human Primary Cell Atlas (top) and the Monaco Immune Dataset (bottom) hosted by celldex.
The top t-SNE shows annotation using the Human Primary Cell Atlas main cell type resolution. The bottom t-SNE shows annotation using the Monaco Immune Dataset fine cell type resolution. The heatmaps on the right indicate confidence in the assigned annotations: Each column on the heatmap represents a single cell from the dataset, and the colored bar across the top indicates all the possible cell types. Each row represents a different cell type or cluster that cells might belong to, and the row labels indicate the dominant cell type determined for that cluster. The score in each cell of the heatmap (represented by color) quantifies how well the gene expression profile of a single cell matches the reference profile of the cell type in that column.
The top heatmap indicates high confidence in the main cell type annotations for Monocytes, B cells, and NK cells assigned using the Human Primary Cell Atlas as a reference. CD 8+ and CD4+ T cells are closely related and more difficult to distinguish, so many CD4+ T cells also closely match the expression of reference CD8+ T cells. Similar results are observed in the annotation using the Monaco Immune Dataset: Between distinct cells types (i.e., NK cells and monocytes) there is clear differentiation, but within a cell type (Switched memory B cells, Non-switched memory B cells), the distinction is not as strong.